Early-stage B2B startups often run some marketing experiments, perhaps even see some initial success, but many are then unsure how to take the next step. How do you tie the various campaigns and outcomes into one coherent marketing plan? Even more importantly, how do you tie marketing efforts, often measured by leads or MQLs, to top-line company goals, measured by revenue (MRR / ARR) and number of deals?
Then comes the end of the year, and with it, financial planning. The company sets revenue goals for the following year, and wants to allocate some budget to marketing. How do you decide what the marketing budget should be? Or given a budget, how do you assess your––and the company’s––ability to achieve your growth goals?
The simple spreadsheet we present in this post can help you build a basic annual marketing plan, including:
- Marketing budget
- Budget allocation across marketing channels and headcount
- Tying marketing output to top line company goals
You can open the spreadsheet here to follow our breakdown below.
The mechanics of the spreadsheet work by starting with the company’s ARR goals and backing into the number of new deals and new Sales Opportunities required to hit them. This is the “Top Down” number the marketing team will be aiming for.
Note: Sales Opportunities is our favorite primary marketing KPI (more on that in a separate post). However, for the purpose of this model, it can be replaced with other KPIs like Leads, MQLs, SQLs etc. The only thing that will need to be adjusted is the Close Rate.

In this example, the company aims for $5M in ARR in 2022. With an ACV of $100K per deal, it will need to close 50 new deals in 2022.
With a 25% close rate, it means the Marketing team will need to create 200 new Sales Opportunities (out of which, 50 will become new deals).
Note that this simple model doesn’t take into account any time delay (it assumes all Opportunities opened in 2022 will be closed [won or lost] in 2022, and that no 2021 Opportunities will close in 2022).
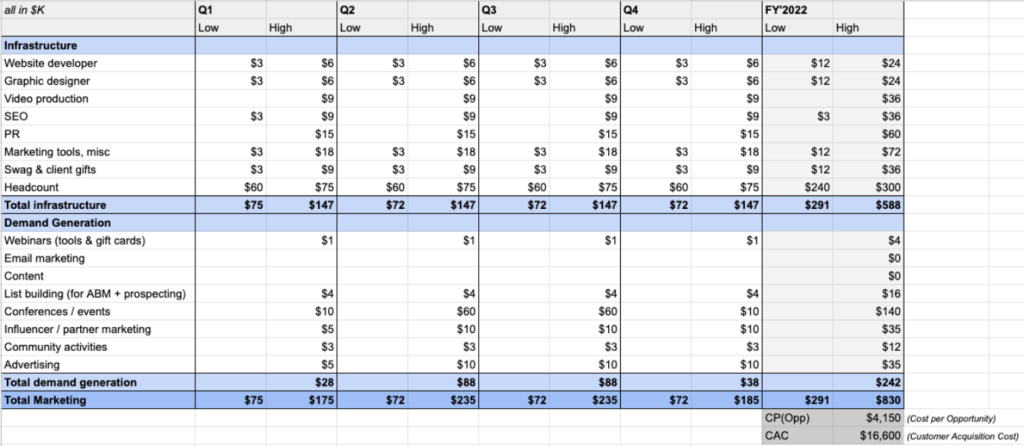
The budget is also planned Bottom Up according to channel activity. We can then assess the total budget, as well as the cost to acquire a customer (CAC), to make sure they fit any Top Down constraints given to us by the CEO or CFO.

In this example, we come in at $830K total marketing spend (including headcount) for the year. With 50 new deals signed, our CAC is $16.6K – not bad for a $100K ACV.
Access the spreadsheet here. We’d love to hear your questions and comments – feel free to drop a comment or contact us.


