You decided to experiment with a Google AdWords campaign. Or maybe it’s a Facebook campaign, or a paid newsletter sponsorship, or actually a conference you attended.
The common thread is that as a result of your paid campaign, you got some new leads. And by dividing your $ investment by the number of leads generated, you know your Cost per Lead, or CPL. But how do you assess whether this number is high or low? How do you know whether the campaign was successful, at least in terms of lead generation? Or better yet, how do you determine in advance what should be your target, or max, CPL?
In this post, we’ll go over a simple funnel mini-model that will help you answer these questions. It can be easily adapted to any paid channel, and to funnels with different stages.
Once you review the model, you’ll realize that these questions cannot be answered with “industry benchmarks,” “best practices,” or other absolute numbers. $100 CPL might be expensive for one company, and $1000 may be totally fine for another. The difference? Several factors, including how much you’re willing to invest to acquire a customer (in other words, your max CAC = Customer Acquisition Cost), and your funnel conversion rates.
Let’s look at how this might work for a conference campaign. The model breakdown and explanations are below, and you can get the corresponding PDF here.
The model itself is quite simple. We start with assumptions about our marketing & sales funnel conversion rates:

You set these assumptions based on historical data or, if you don’t have a lot of data yet, educated guesses / industry benchmarks. Over time, as you gather more data, the assumptions would become more accurate.
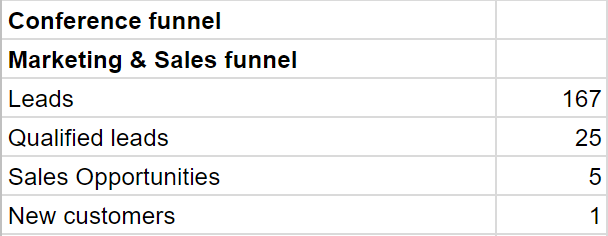
Next, we use the funnel conversion rate assumptions to calculate the number of Sales Opportunities, Qualified Leads, and Leads you need to close one new customer.

The calculation is done “backwards” (bottom to top). We start with the goal (1 new customer) and divide it by the Close rate to get the number of Sales Opportunities you need to create (five, in this example). And so on up the funnel, until we get to the number of leads you should start with in order to eventually close one customer – 167 in our example.
Then we turn to cost: how much you can afford to pay per lead, qualified lead, and per opportunity.
One additional underpinning assumption you make here is your maximum allowable CAC. Your max CAC is influenced by several factors (which we might go into in a future post), like your ACV (Average Contract Value, or deal size), and your need for profitability. Also, for the sake of our model, CAC pertains to marketing costs only, and does not include sales and other acquisition costs. In this example, the CAC was set at $2000 (in a different process).

Once we have our CAC, we simply use the same conversion rate assumptions to calculate what your maximum Cost per Opportunity, Cost per Qualified Lead, and Cost per Lead are. In this example, your maximum Cost per Lead is $12. As a sanity check, multiplying $12 by the 167 leads we previously calculated we needed to close a single customer, we get to $12 X $167 = $2000, which is our max CAC.
So for this particular example with all of the corresponding assumptions, we can afford to pay $12 per lead.
The spreadsheet also contains a similar model for an online ad campaign (simply adding more assumptions for clickthrough rate and lead conversion). In a similar fashion, you can create additional models for any other channel; simply modify the funnel to fit the conversion stages of the particular channel (usually you’ll only need to modify the top part of the funnel).
You can also use the model to assess performance of an existing campaign and estimate your CAC by essentially flipping the funnel upside down.
Get the spreadsheet here, and let us know if you have any questions or comments.


